
Simanaitis Says
On cars, old, new and future; science & technology; vintage airplanes, computer flight simulation of them; Sherlockiana; our English language; travel; and other stuff
TRADE IMBALANCES: THE U.S., CHINA, THE EU, THE WORLD
“WHO CAN blame a country for being able to take advantage of another country for the benefit of its citizens? I give China great credit.” So proclaimed the U.S. president to his Chinese counterpart and business leaders in Beijing on November 9, 2017.
Inexplicably to many, the person making this statement said only 17 months ago, “We can’t continue to allow China to rape our country, and that’s what we’re doing.”
Politics sure do make for strange bedfellows.
These two Trump pronouncements got me thinking about international trade and various imbalances around the world. What about the U.S. versus everyone else? The U.S. versus China? The European Union versus China? And how are these data compiled anyway?
Definitions: Goods, Services, and FDIs. Three distinct things get traded: Goods are actual stuff, cars, computers, and the like. Services are things like transport, communication, and information processing. FDIs are foreign direct investments involving investors in one country acquiring assets in another.
In researching these data, I found some sources combine all three, goods, services, and FDIs. Others treat FDIs separately. Also, because of the complexities in assembling such data, there’s often a lag in reporting: Some data may refer to 2010, others to 2017.
Here are selected tidbits. It turns out the typical units are millions or billions of dollars, with some inevitable rounding.
U.S. versus Everyone Else. The U.S. Census Bureau shows an imbalance in U.S. international trade of goods and services for 2016 of -$504.8 billion.
![]()
However, the split of goods and services is interesting: In 2016, U.S. imported goods totaled $2,208 billion; its exported goods were worth $1,455 billion (hence a goods imbalance of -$753 billion).
On the other hand, the U.S. exported more services than it imported: $752 billion versus $504 billion. That is, in 2016, the U.S. service sector contributed positively to our trade balance, to the tune of $248 billion.
![]()
A similar situation existed in FDIs: According to selectusa.gov, the U.S. is the largest single recipient of foreign direct investment in the world. In 2016, foreigners invested $3,725 billion in the U.S. By contrast, we bought into only $3,268 billion of companies outside the U.S., thus generating a net imbalance of $457 billion.
U.S. versus China According to the Office of the United States Trade Representative, U.S. exports of goods and services to China totaled $169.3 billion in 2016. Imports from China totaled $478.9 billion, thus leaving a U.S./China goods and services imbalance of -$309.6 billion.
![]()
The U.S./China good/services split was similar to that of the U.S. and the rest of the world: There was a U.S./China goods imbalance of -$347.0 billion and a corresponding service surplus of $37.4 billion.
In 2016, China was the largest supplier of goods to the U.S. It was also among the largest recipients of goods exported from the U.S., including agricultural products, aircraft, electrical and other machinery, and vehicles. Other significant U.S. export markets were the European Union and Canada.
The latest Trade Representative FDI data are from 2015. U.S. foreign direct investments in China totaled $74.6 billion. Chinese FDI in the U.S. totaled $14.8 billion. That is, considerably more U.S. investors plunked their money in China than vice versa, with a U.S. FDI imbalance of -$59.8 billion.
On the other hand, according to Reuters, November 13, 2016, “U.S.-China FDI Far Higher Than Official Data Shows.”

Citing a report from Rhodium Group, Reuters notes that U.S. investment flow to China has been declining since 2012, partly attributable to China’s slower economy, partly to Chinese government restrictions. “According to Rhodium,” Reuters writes, “Chinese investments into U.S. exceeded that of U.S. investment into China for the first time in 2015.”
European Union versus China. According to the European Commission, “China is now the EU’s second-biggest trading partner behind the United States, and the EU is China’s biggest trading partner.”

The commission continues, “Although the EU currently had a trade deficit with China, this is compensated by European exports to other destinations; in fact, the EU’s overall trade balance is positive.”
Another view is offered by the Financial Times, July 12, 2016, in reporting “EU Trade Deficit With China Hits €180bn.” That is, -$210 billion, compared with the U.S./China value of -$309.6 billion.

The Financial Times article contains interesting contrasts among EU members and their trade imbalances in goods with China. In particular, Germany had a positive goods trade; Finland was also slightly positive. Pre-Brexit Britain was particularly negative, as was the Netherlands. Indeed, both called for an extended scale of negativity.
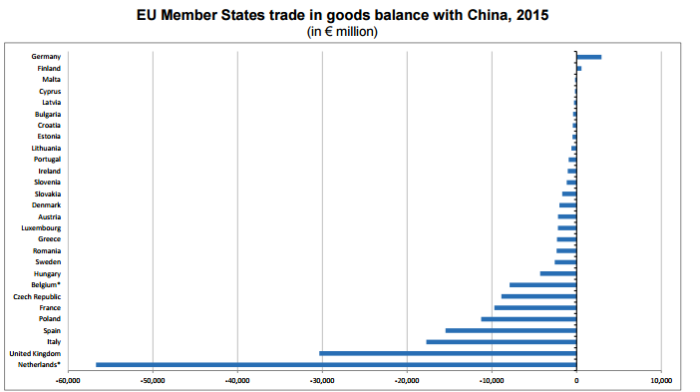
EU member states and their imbalances in goods with China, 2015 (in € millions). Image from the Financial Times, July 12, 2016.
I wonder what Minister-President of the Netherlands Mark Rutte or Britain’s Theresa May would say to Xi Jinping? ds
© Dennis Simanaitis, SimanaitisSays.com, 2017
