
Simanaitis Says
On cars, old, new and future; science & technology; vintage airplanes, computer flight simulation of them; Sherlockiana; our English language; travel; and other stuff
A POPULATION SNAPSHOT FROM LEATHERBY AND MCCANN PART 1
DEMOGRAPHIC DATA ARE fascinating. “Sweden Stayed Open. A Deadly Month Shows the Risks,” by Lauren Leatherby and Allison McCann, in The New York Times, May 17, 2020, is a compelling topic. The article’s basic premise, that Sweden’s lack of lockdown had its tradeoffs, is certainly interesting.
But what I found particularly fascinating is the authors’ Population Snapshot of European countries and the U.S. as seen through five filters: These are 1) Share of single-person households, 2) Population per square kilometer, 3) Share of population 65 or older, 4) Obesity rate, and 5) Share of population with diabetes.
Each of these affects each country’s Covid-19 history, a topic I won’t address here. For that, I encourage you to read the Leatherby/McCann analysis.
Instead, what follows here, in Parts 1 and 2 today and tomorrow, are tidbits gleaned from the Population Snapshot, together with my usual Internet sleuthing. I’ve focused on the U.S., Sweden, and six other countries that display extremes of the relevant metrics: Italy, the Netherlands, Norway, Portugal, Spain, and Switzerland.
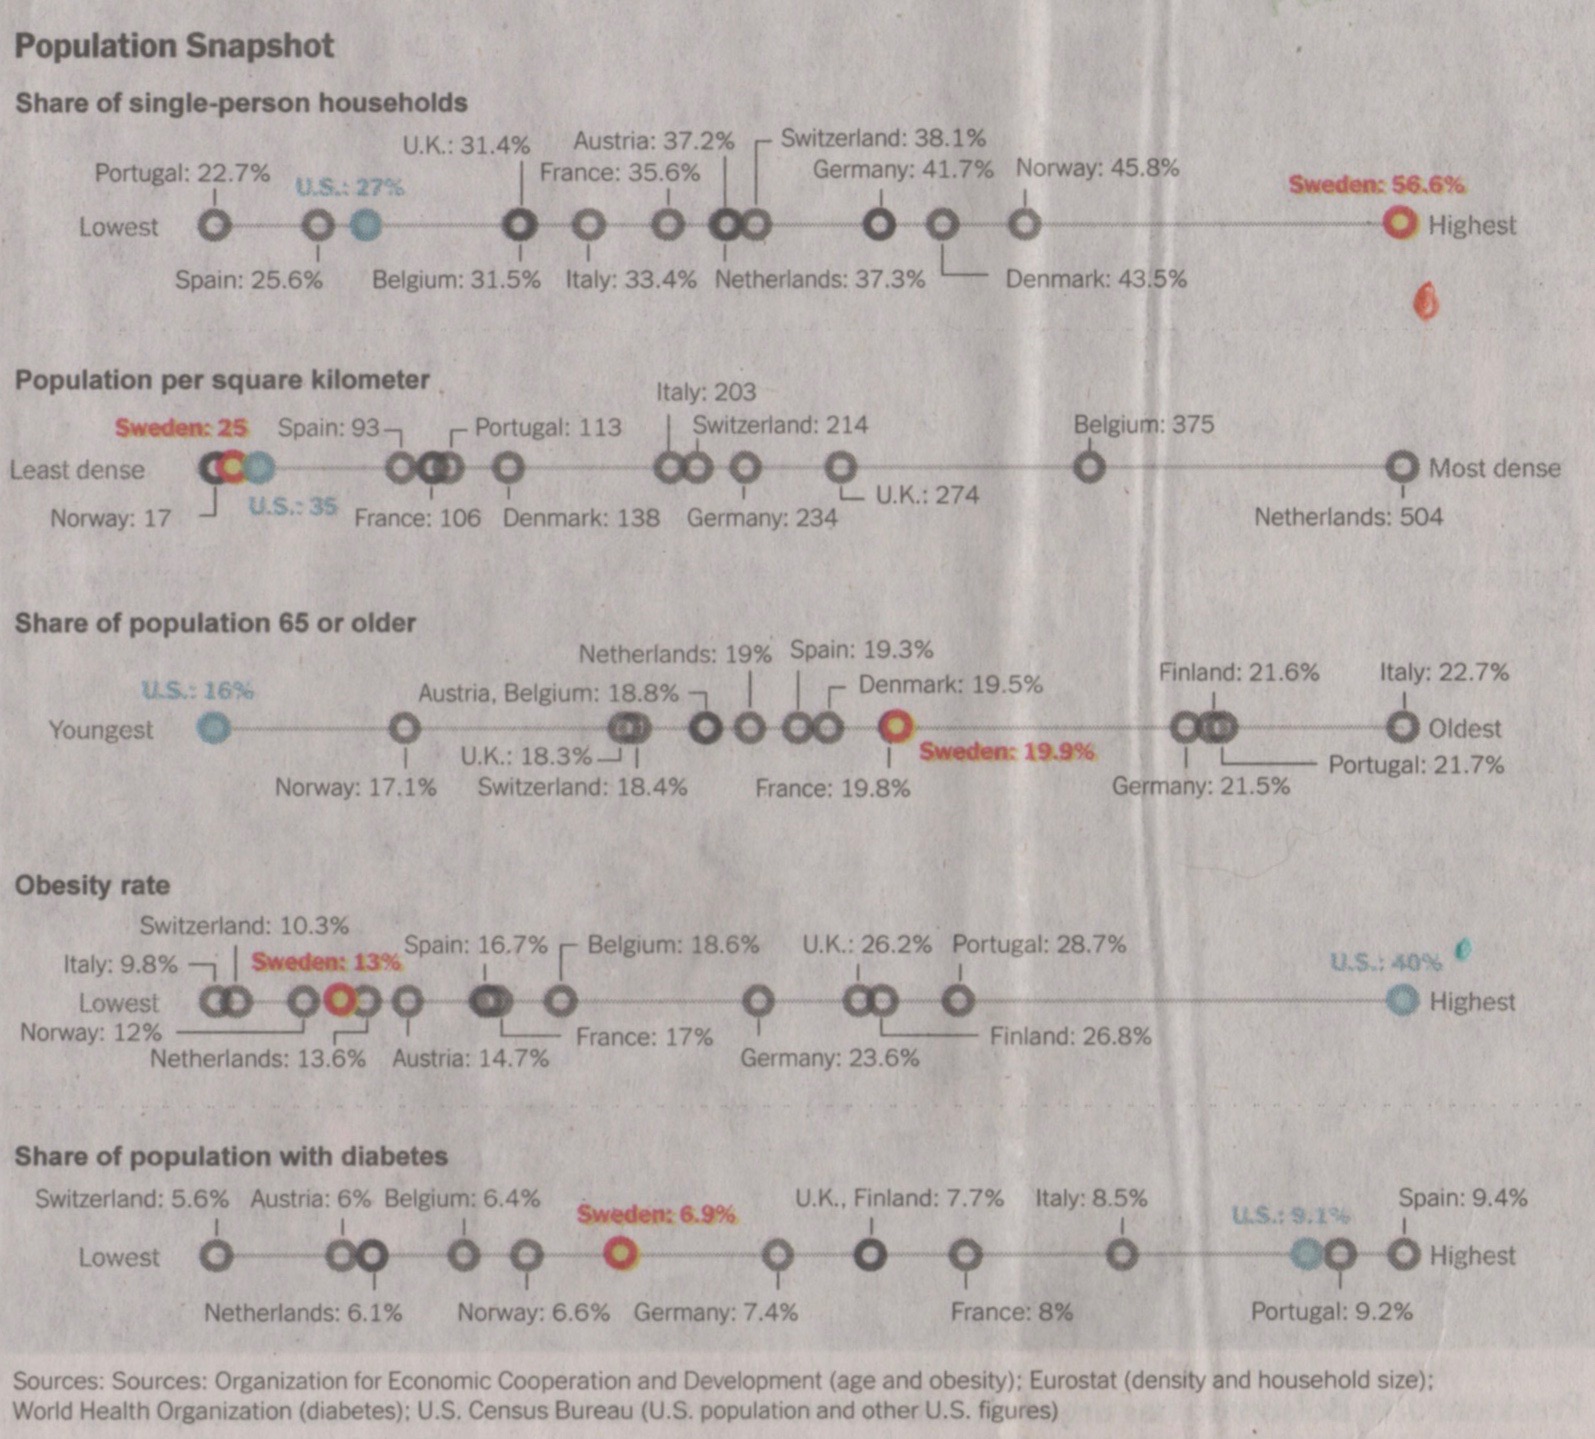
I apologize for the reproduction quality of this scan taken directly from my well-read copy of the newspaper. Alas, the article’s online graphic identifies only U.S. and Swedish data points.
Let’s begin our data tour.

Italy.
Italy. Italy has the most people 65 or older, 22.7 percent. Portugal comes close at 21.7 precent. The U.S. is at the opposite extreme, and not all that far away from Italy at 16.0 percent.
Though not in this study, Japan is often cited as an aging country, with 26 percent of its population 65 and older. Indeed, it’s not decidedly greater than Italy’s figure.

The Netherlands.
The Netherlands. By a considerable amount, the Netherlands has the highest density, 504 people per sq. km. Belgium is next, and not particularly close at 375/sq. km.
I wonder: Do the Dutch live in the smallest European country listed here? No, actually Belgium is smaller: 30,510 sq. km. versus the Netherlands’ 41,198 sq. km. Switzerland, at 41,290 sq. km., is only a tad larger than the Netherlands. (Belgium, for example, is about the size of the U.S. state of Maryland.)
No fair including Monaco and other European micronations, right? This tiny Principality has 18,960 people per sq. km.

Norway.
Norway. Rugged Norway is the least dense of our list, at 17 people/sq. km. Sweden is next, at 25/sq. km. And the vastness of the U.S. gives it a relatively few 35 people/sq. km.
A little data humor: The U.S. would have more people per sq. mile. And they’d be hotter too in Fahrenheit degrees….
Uh, I better stop here. We’ll complete our tidbits tour tomorrow in Part 2. ds
© Dennis Simanaitis, SimanaitisSays.com, 2020
