
Simanaitis Says
On cars, old, new and future; science & technology; vintage airplanes, computer flight simulation of them; Sherlockiana; our English language; travel; and other stuff
WELL OILED
WHAT WITH CONFLICTING and often misleading news and opinions about the U.S. oil business, it’s helpful to consult a reliable source now and then. The U.S. Energy Information Administration offers independent statistics and analysis on such matters. Today I offer several tidbits that update an earlier posting that appeared here at SimanaitisSays.
![]()
In 2015, the U.S. imported an averaged 4.7 million barrels of petroleum per day; this, of its 19.5 MMb/d consumption. This 24 percent is the lowest level of imports since 1970. In fact, the U.S. is a net exporter (i.e., exports minus imports) of petroleum liquids and refined products. The U.S. also exports crude oil, 92 percent of which went to Canadian refineries.
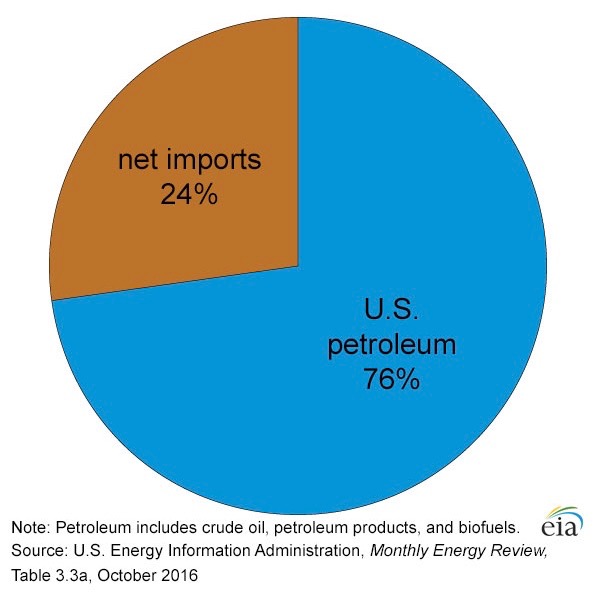
U.S. Domestic Petroleum Production and Net Imports of Petroleum as Shares of Consumption, 2015. These and the following data are from the U.S. Energy Information Administration.
The influence of the Organization of Petroleum Exporting Countries was strongest in the early 1970s. OPEC’s share of U.S. imports reached a peak of 70 percent in 1977, but has been generally declining since.
In 2015, OPEC’s share of total U.S. petroleum imports was about 31 percent. It’s worth emphasizing as well that the Persian Gulf accounted for only about half of this. That is, U.S. imports from this troubled region of the world accounted for about 16 percent of its total.

The OPEC flag. The Organization of Petroleum Exporting Countries was established in 1960, with Iran, Iraq, Kuwait, Saudi Arabia and Venezuela its original members.
Thirteen nations are OPEC members today: Algeria, Angola, Ecuador, Gabon, Iran, Iraq, Kuwait, Libya, Nigeria, Qatar, Saudi Arabia, United Arab Emirates and Venezuela. Saudi Arabia is the OPEC powerhouse, contributing 30 percent of 2015 world production. However, Venezuela beats even Saudi Arabia, with 11 percent more proven reserves.
And, as far as the U.S. is concerned, its primary supplier isn’t the Persian Gulf nor any particular OPEC country. It’s Canada, and has been for year after year.
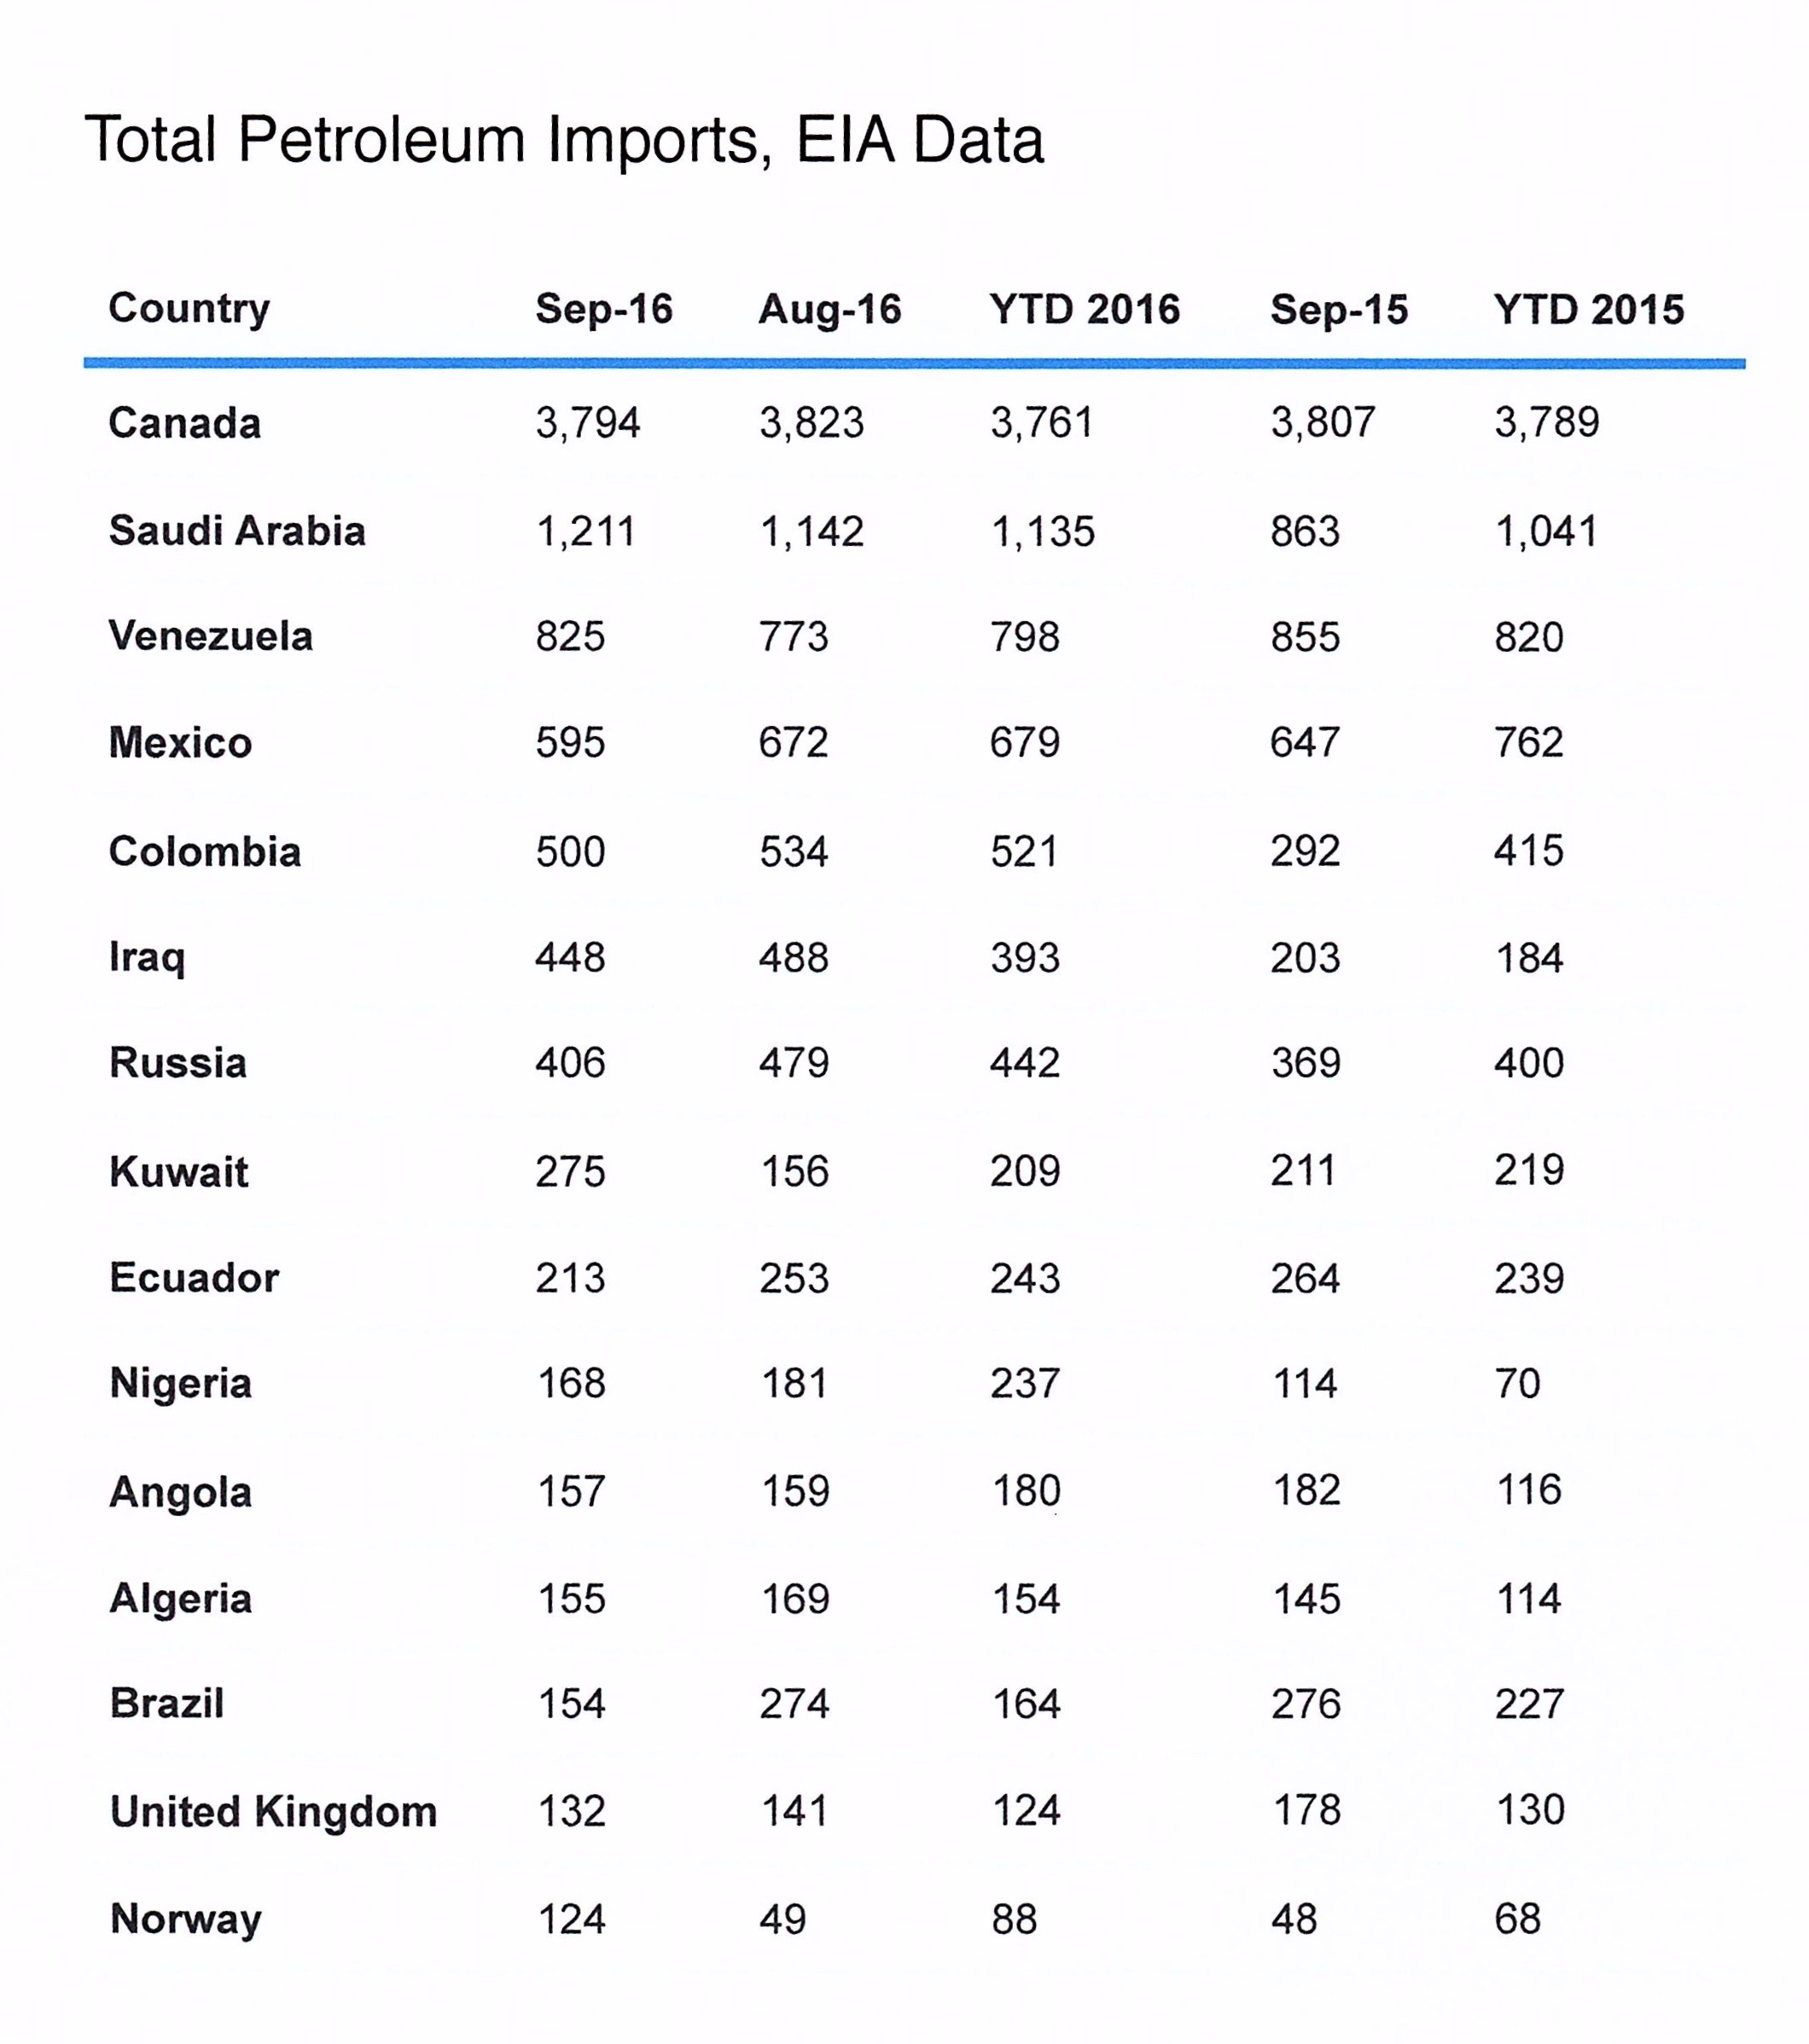
The units are a thousand barrels per day.
The EIA data for September 2016 are typical. Canada accounted for almost 42 percent of U.S. petroleum imports. In previous years, Mexico and Saudi Arabia have tied for second, though the latter has pulled away into a solid second ranking, with Venezuela moving up.
The top five countries accounted for 78 percent of U.S. crude oil imports. The top ten comprised 93 percent of the total. Four of the top five countries are in the Western Hemisphere, Venezuela a member of OPEC.
There are complexities galore in this choice of suppliers, including politics, economics and petro technicalities. As an example, crude oil from Venezuela, Mexico and Columbia has a modest transportation component for U.S. refineries. However, crude from this region is generally high in sulfur and requires additional investment at the refinery stage. For years, Nigeria’s Bonny Light has been the world’s standard for low-sulfur crude, thus demanding a premium on petroleum markets.
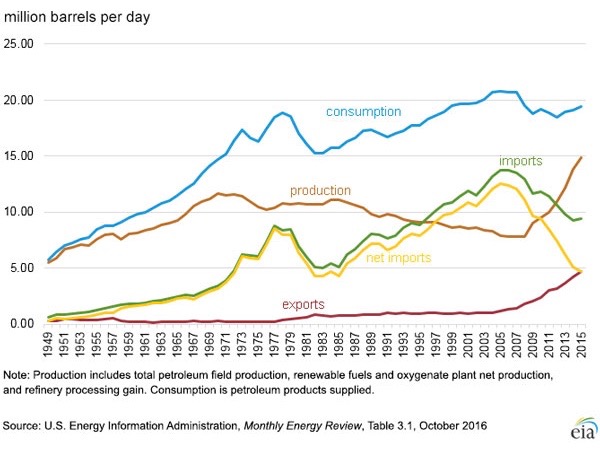
A Yearly Summary of U.S. Data, 1949–2015.
The Energy Information Administration is an excellent source, with updates on almost a daily basis. It’s well worth a visit to the EIA. ds
© Dennis Simanaitis, SimanaitisSays.com, 2016
